A focused ESG data analysis for companies with very delineated
analytical needs, which offers a detailed insight into a material ESG
topic to benchmark your company’s performance on the subject.
Thematic
Data Analysis
Report (T-DAR)

To learn more about ESG Benchmarking services, please visit here.
2
Contents
01 Thematic Data Analysis Report (T-DAR) Overview ........................................................ 3
02 T-DAR Product Modules ....................................................................................................... 5
03 T-DAR Pricing and Service Options ..................................................................................... 10

To learn more about ESG Benchmarking services, please visit here.
3
01 Thematic Data Analysis Report
(T-DAR) Overview
The Thematic Data Analysis
Report (T-DAR) is available as a stand-alone service for companies that have participated in
the S&P Global Corporate Sustainability Assessment (CSA). The T-DAR is designed to address the need of having a
complete overview and in-depth analysis on a pre-defined ESG topic material for your company and stakeholders. The
data used in the report are from the CSA and other proprietary databases. The report is built in a modular way, so that it
is possible to include an analysis of the company’s performance on the topic based on the CSA scores and data as well
as to benchmark the execution against a selected peer group of companies.
This service is designed to support management decisions and to better understand the sustainability performance of
the outlined peer groups included in the analysis.
The analysis is defined by the featured topic. The level of detail and depth of the report by the customer.
What do you get?
The service consists of a report in presentation format, covering, depending on the level of depth chosen by the
customer (Basic, Starter, Expert), the following modules:
Thematic Data Analysis Report (T-DAR) Basic
• General theme overview
• Relevance of the topic for the stakeholders and company performance
• Rationale and expected practices
• Data analysis of the topic at industry and country level
T
hematic Data Analysis Report (T-DAR) Starter
• All the components of the T-DAR Basic report
• Benchmarking of the company performance on data-point level versus peers in the industry and in the countries
of reference
• Gap- Analysis with respect to the CSA expected practice for the relevant aspects
T
hematic Data Analysis Report (T-DAR) Expert
• All the components of the T-DAR Starter report
• Benchmarking of the company performance on data-point level versus a selected peer group
• Descriptive statistics on scores of peer companies
T
hematic Data Analysis Report (T-DAR) Debriefing Call
• Presentation and
discussion of the results of the Thematic Data Analysis Report (T-DAR)

To learn more about ESG Benchmarking services, please visit here.
4
Who benefits from this service?
Companies looking to understand and improve their relative performance in a specific material sustainability topic,
deemed as relevant for the capital market and the broader society.
The T-DAR represents a benchmarking tool to support management decisions on continuous improvement of
sustainability practices in key topics by gaining insights on the performance of the reference industry, region, and
selected peer groups.
How do you benefit?
Obtain focused, objective information and statistical evidence to:
• Gain insight into your key strengths and weaknesses in specific material sustainability topics
• Advance key sustainability issues within your organization
• Develop a targeted roadmap to gain and progress in key areas
• Allocate your sustainability resources more efficiently
The Thematic Data Analysis Report (T-DAR) provides detailed insights on a relevant
sustainability topic in a modular way
The T-DAR is a report on a specific sustainability topic built in a modular way,
enabling the customer to select three
levels of detail of the analysis based on its benchmarking needs. The customer can choose between T-DAR Basic, T-DAR
Starter and T-DAR Expert. The examples for each module are provided below for information purposes only.
To learn more about ESG Benchmarking services, please visit here.
5
02 T-DAR Product Modules
Thematic Data Analysis Report (T-DAR) Basic
The T-DAR Basic provides a general overview of the theme and the materiality of
the subject for the different
stakeholders and for the company. It includes an overview on how the topic is addressed in the CSA and describes the
rationale and expected practice. The data collected in the CSA and other proprietary datasets are then used to deep
dive in the topic in the form of an analysis at industry and country level.
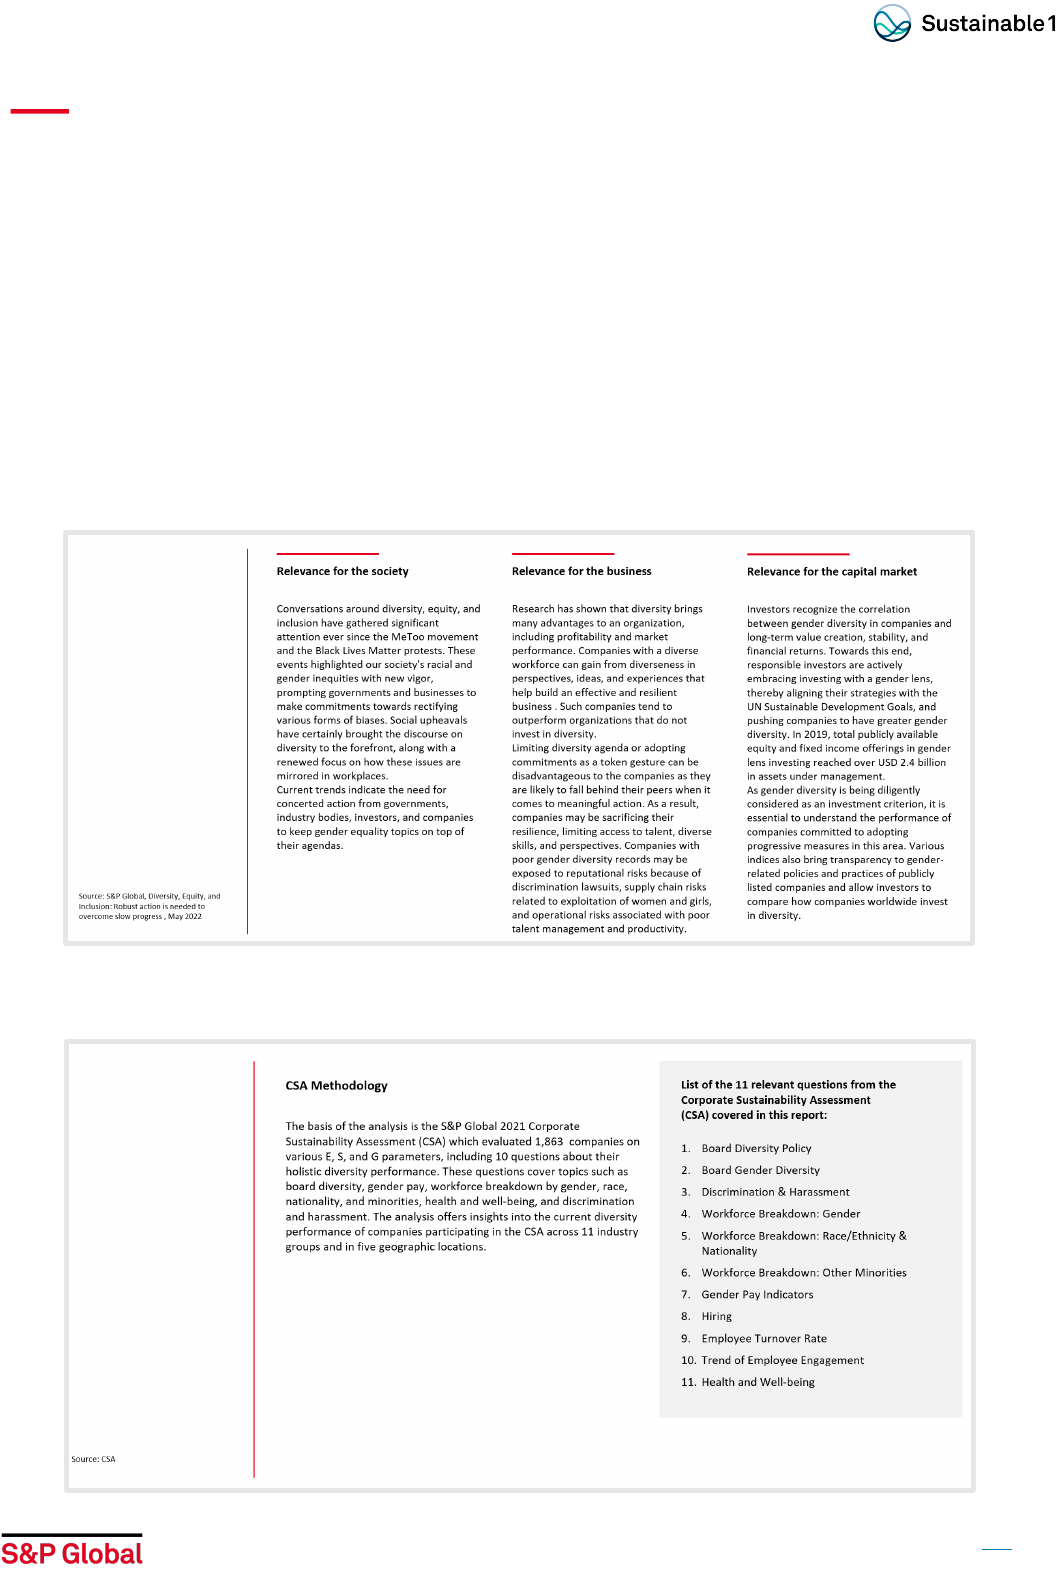
General theme overview: Relevance of the topic for the stakeholders and company
performance
Understanding the relevance of the team for the society, company, and capital market.
Explaining how the CSA Methodology approaches the theme
To learn more about ESG Benchmarking services, please visit here.
6
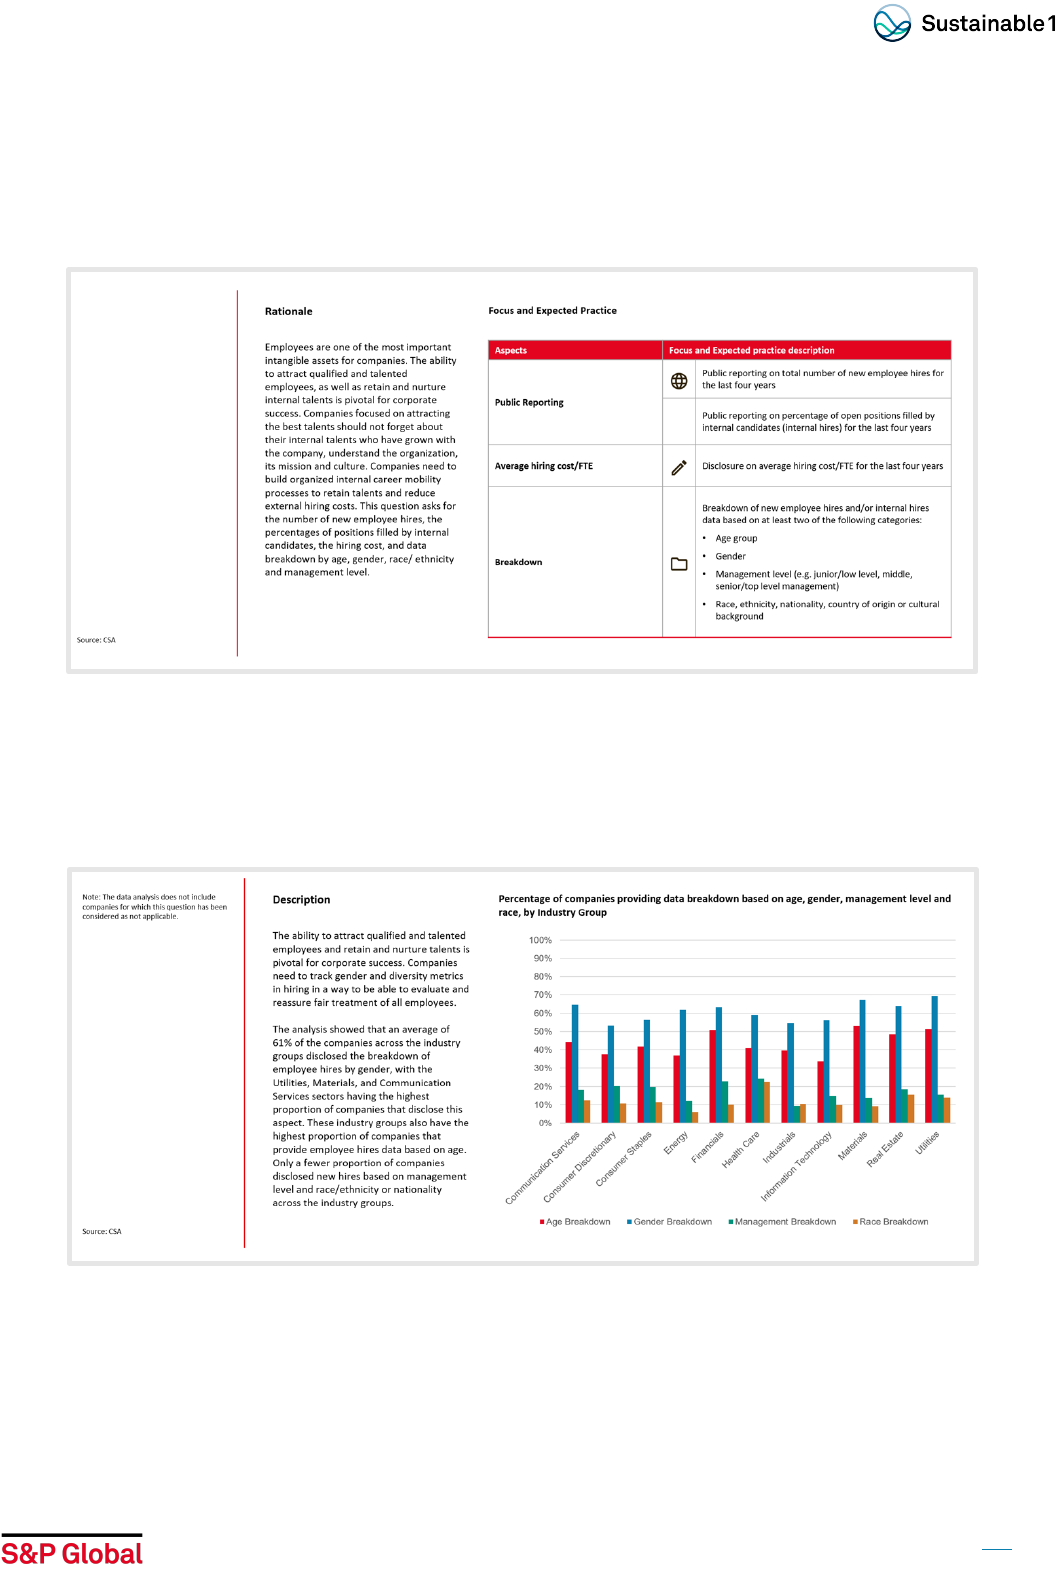
Rationale and expected practice
Based on the CSA Methodology the rationale and expected practice of each of the aspects relevant for the theme are
presented in the report.
Data analysis of the topic at industry and country level
Insight into industry and country reporting behavior in the form of easy-to-use visualizations including descriptive
information to highlight certain patterns readable from the charts.
To learn more about ESG Benchmarking services, please visit here.
7
Thematic Data Analysis Report (T-DAR) Starter
The T-DAR Starter includes all the components
of the T-DAR Basic and in addition provides a benchmarking of the
company performance on data-point level versus peers in the industry and in the countries of reference. A gap-analysis
with respect to the CSA expected practice for the relevant aspects in the format of an easy-to-read table is incorporated
in the report, describing your strengths and weaknesses.
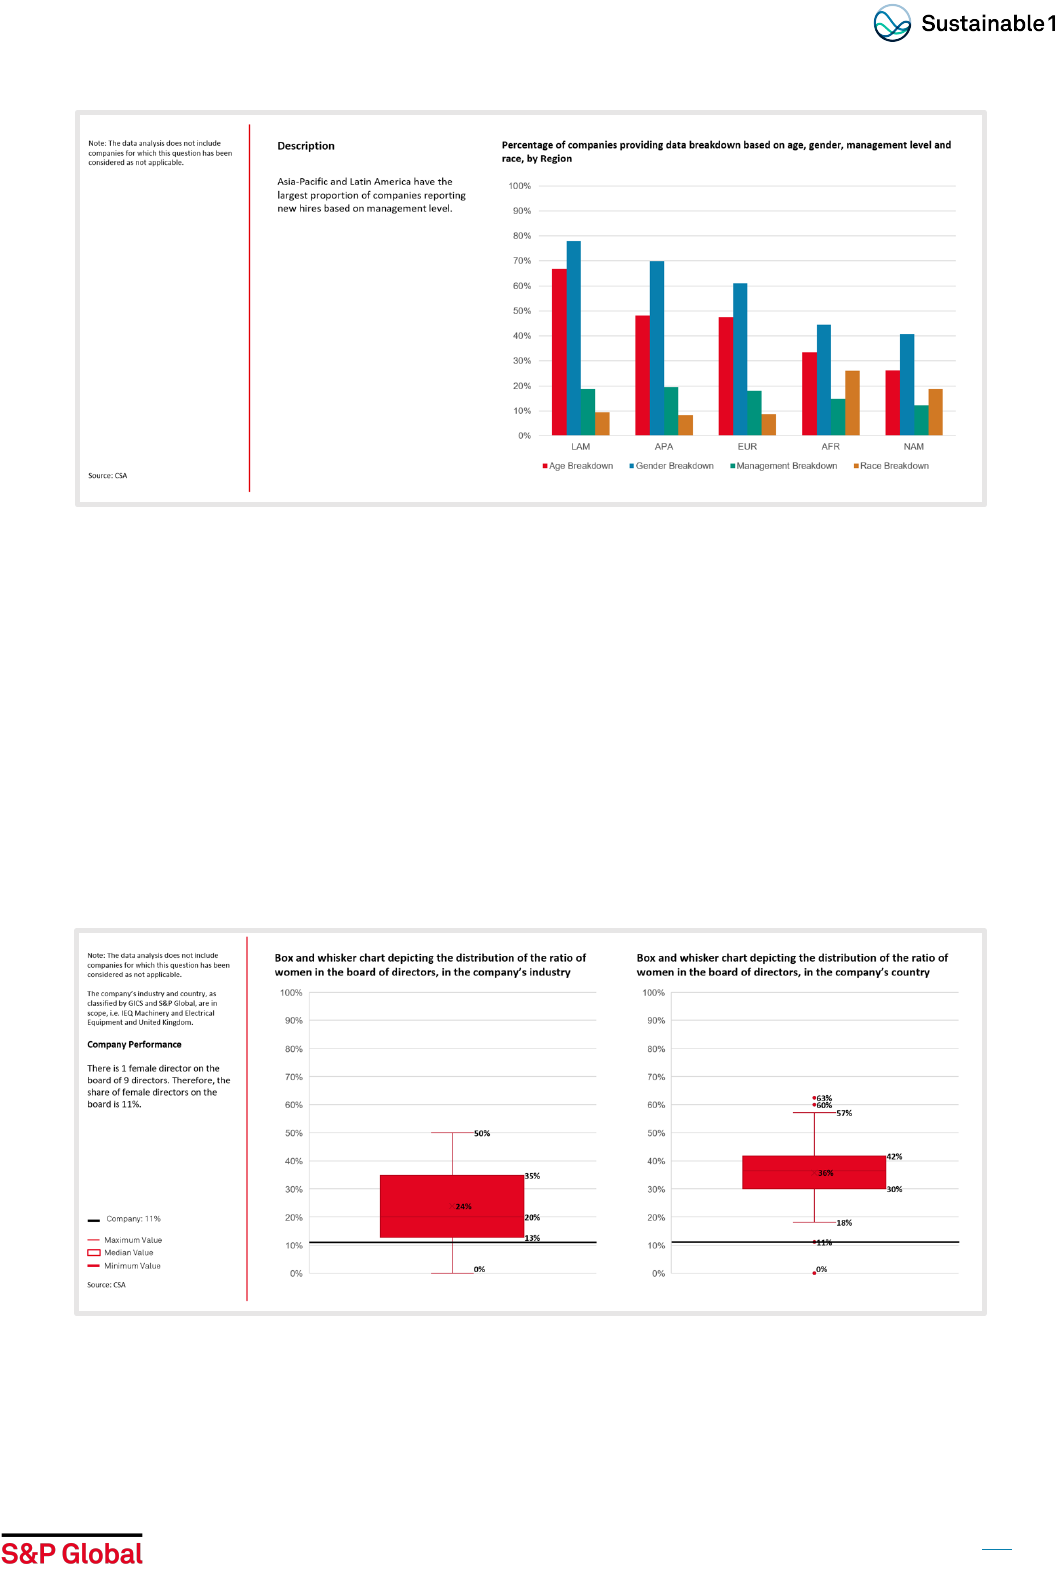
Benchmarking of the company performance on data-point level versus peers in the industry
and in the countries of reference
Clear visualizations based on statistics derived from the datasets to better understand your positioning within the
different reference groups and compare your company metrics and indicators within your industry and geography.
Depending on the datapoint the statistical information is illustrated with a chart. The company performance is described
and illustrated in the charts where appropriate.

To learn more about ESG Benchmarking services, please visit here.
8
Question-level Gap Analysis: Understand Your Strengths and Weaknesses
An item-by-item review of your assessment results for the selected questions.
Icons provide a quick visualization of strengths and areas for improvement, based on the following assessment types:
disclosure, (public) availability of documents, data coverage, trend/performance, awareness and third-party verification.
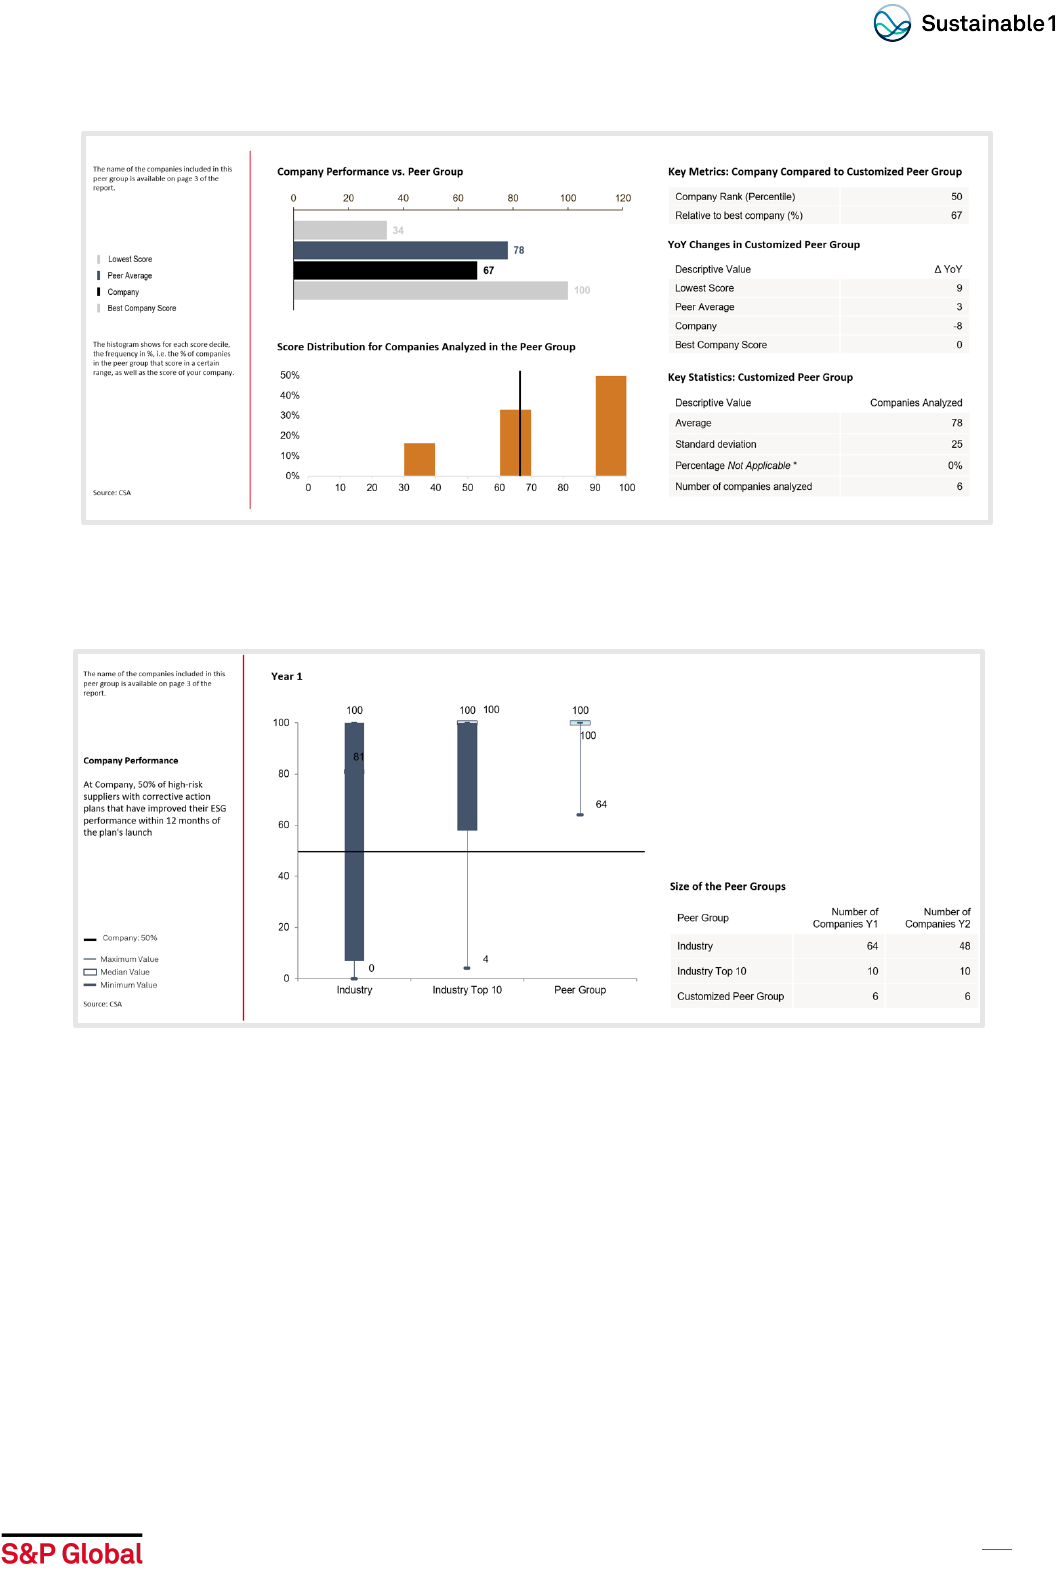
Thematic Data Analysis Report (T-DAR) Expert
The T-DAR Expert includes all the components of the T-DAR Starter and in addition it foresees the possibility to add a
selected peer group of companies of your choice. Descriptive statistics on scores of peer companies are integrated into
the report.
Benchmarking of the company performance on data-point level versus a selected
peer group
Insight into industry, geography, and peer group reporting behavior and transparency.
Easy-to-use visualization of differences in reporting and transparency (as applicable) between industry, country, and
your peer group. This benchmarking information can support you in making your case for the (public) reporting of certain
data or increased transparency on company procedures and guidelines.
Descriptive statistics on scores of peer companies: your relative position to your peers for each question included in
the report.
To learn more about ESG Benchmarking services, please visit here.
9
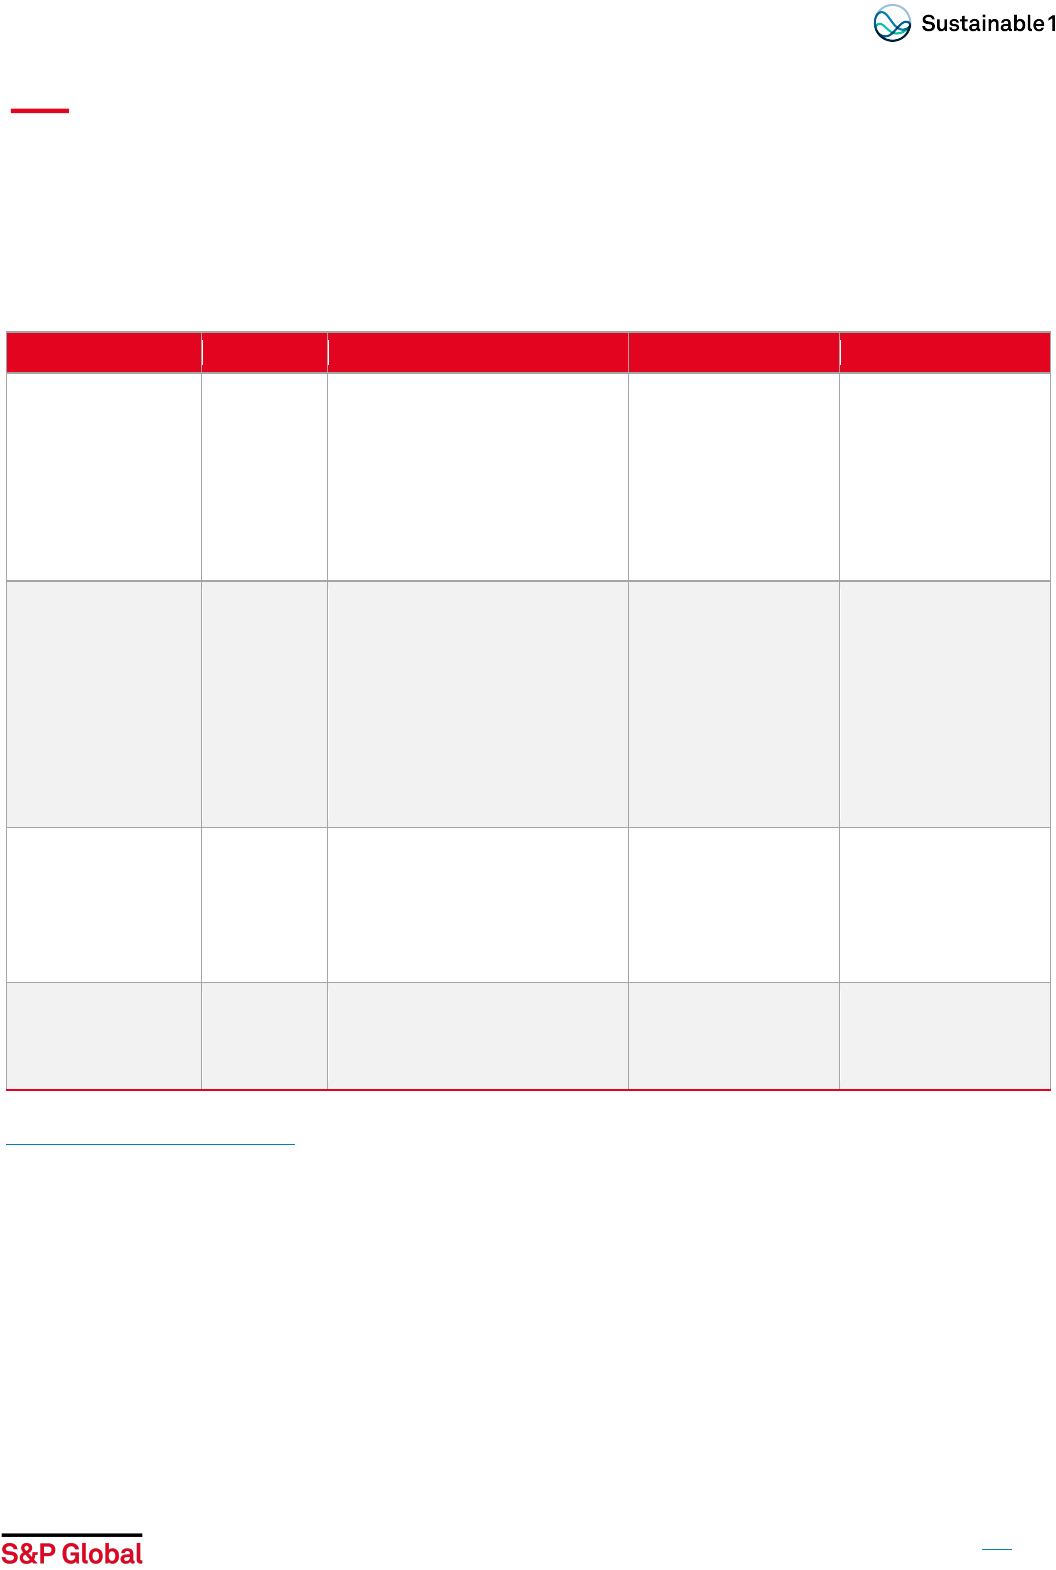
This report enables you to debate your case internally showing statistics derived from your peer group and top
performers and compare your company metrics and indicators with your industry, industry top performers, and your
selected peer groups.
Comp
lementary services: the T-DAR can be bought as stand-alone or in combination with other services based on
the CSA.
Thematic Data Analysis Report (T-DAR) Debriefing Call
T-DAR Debriefing Call: presentation and discussion of the results of the T-DAR report.
To learn more about ESG Benchmarking services, please visit here.
10
03 T-DAR Pricing and Service Options
The T-DAR is available throughout the year for selected themes. Please get in touch with the team to learn more
about the topics available for the analysis. Please refer to the table below for more details and feel free to contact us
to identify the solution that best meets your needs.
Service
Deliverable
Components
Delivery Specifications
Service Fee
Thematic Data
Analysis Report
Basic
Report
Approx. 20
pages
• General theme overview
• Relevance of the topic for the
stakeholders and company
performance
• Rationale and expected
practice
• Data analysis of the topic at
industry and country level
Report delivery 4-6
weeks after order date
€ 2’000
Thematic Data
Analysis Report
Starter
Report
Approx. 20
pages
• All components of the Basic
report
• Quantitative benchmarking of
company performance on
data-point level vs. peers in
the industry and peers in the
country
• Gap- Analysis with respect to
the CSA expected practice
for the relevant aspects
Report delivery 4-6
weeks after order date
€ 5’000
Thematic Data
Analysis Report
Expert
Report
Approx. 20
pages
• All components of the
Starter report
• Quantitative benchmarking
of company performance
on data-point level vs
selected peers
Report delivery 4-6
weeks after order date
€ 10’000
Thematic Data
Analysis Report
Debriefing call
Video
conference
1-hour
• Presentation and discussion
of the results of the Thematic
Data Analysis Report
Only together with and
upon delivery of a
Starter or Expert
Report
€ 3’000
To learn more, contact us.
About S&P Global Sustainable1
S&P Global Sustainable1 is the central source for sustainability intelligence from S&P
Global. Sustainable1 matches customers with the ESG products, insights and
solutions from across S&P Global’s divisions to help meet their unique needs. Our comprehensive coverage across global markets combined with in-depth ESG
intelligence provides financial institutions, corporations and governments an unmatched level of clarity and confidence to successfully navigate the transition to a
sustainable future. Our data and well-informed point of view on critical topics like energy transition, climate resilience, positive impact and sustainable finance allow
us to go deep on the details that define the big picture so customers can make decisions with conviction. To learn more about Sustainable1, visit
http://www.spglobal.com/sustainable1.
About S&P Global
S&P Global (NYSE: SPGI) is the world’s foremost provider of credit ratings, benchmarks and analytics in the global capital and commodity markets, offering ESG
solutions, deep data and insights on critical economic, market and business factors. We’ve been providing essential intelligence that unlocks opportunity, fosters
growth and accelerates progress for more than 160 years. Our divisions include S&P Dow Jones Indices, S&P Global Engineering Solutions, S&P Global Market
Intelligence, S&P Global Mobility, S&P Global Commodity Insights, S&P Global Ratings and S&P Global Sustainable1. For more information, visit www.spglobal.com.
This piece was published by S&P Global Sustainable1 and not by S&P Global Ratings, which is a separately managed division of S&P Global.
S&P Global Sustainable1 Disclaimer
This content (including any information, data, analyses, opinions, ratings, scores, and other statements) (“Content”) has been prepared solely for information
purposes and is owned by or licensed to S&P Global and/or its affiliates (collectively, “S&P Global”).
This Content may not be modified, reverse engineered, reproduced or distributed in any form by any means without the prior written permission of S&P Global.
You acquire absolutely no rights or licenses in or to this Content and any related text, graphics, photographs, trademarks, logos, sounds, music, audio, video,
artwork, computer code, information, data and material therein, other than the limited right to utilize this Content for your own personal, internal, non-commercial
purposes or as further provided herein.
Any unauthorized use, facilitation or encouragement of a third party’s unauthorized use (including without limitation copy, distribution, transmission or
modification) of this Content or any related information is not permitted without S&P Global’s prior consent and shall be deemed an infringement, violation, breach
or contravention of the rights of S&P Global or any applicable third-party (including any copyright, trademark, patent, rights of privacy or publicity or any other
proprietary rights).
A reference to a particular investment or security, a score, rating or any observation concerning an investment or security that is part of this Content is not a
recommendation to buy, sell or hold such investment or security, does not address the suitability of an investment or security and should not be relied on as
investment advice.
S&P Global shall have no liability, duty or obligation for or in connection with this Content, any other related information (including for any errors, inaccuracies,
omissions or delays in the data) and/or any actions taken in reliance thereon. In no event shall S&P Global be liable for any special, incidental, or consequential
damages, arising out of the use of this Content and/or any related information.
The S&P and S&P Global logos are trademarks of S&P Global registered in many jurisdictions worldwide. You shall not use any of S&P Global's trademarks, trade
names or service marks in any manner, and in no event in a manner accessible by or available to any third party. You acknowledge that you have no ownership or
license rights in or to any of these names or marks.
See additional Disclaimers at https://www.spglobal.com/en/terms-of-use.
Copyright© 2023 S&P Global Inc. All rights reserved.
